August Economic Recap and the Fed Cuts Rates

Photo Credit: Benoit Deschasaux, Unsplash
Weekly Market Recap for September 19th
This week, markets posted modest gains with a slight risk-on tone. The S&P 500 edged higher, led by Technology, Growth, and High Beta, while defensives such as Health Care, Consumer Staples, and Low Volatility lagged. Small caps outperformed, with the Russell 2000 extending its recent outperformance over the S&P 500. International returns were mixed as the US dollar traded sideways: developed was flat, and emerging outperformed US stocks. In fixed income, the Treasury curve steepened after the Fed cut rates, pushing the back end higher. Longer-duration bonds underperformed short- and intermediate-duration bonds, and high-yield outperformed investment-grade. Oil gained +2%, while gold finished unchanged.
S&P 500 Index (Last 12 Months)

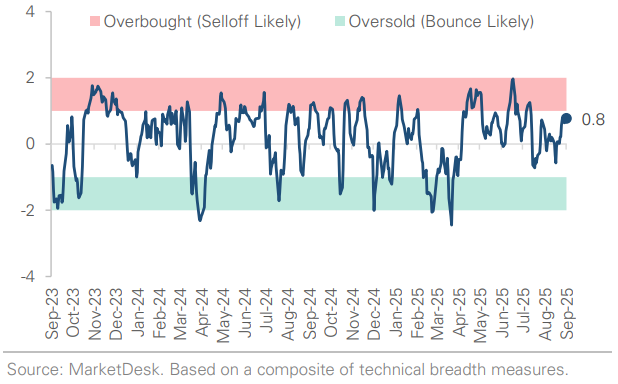
S&P 500 Technical Composite (Last 24 Months)
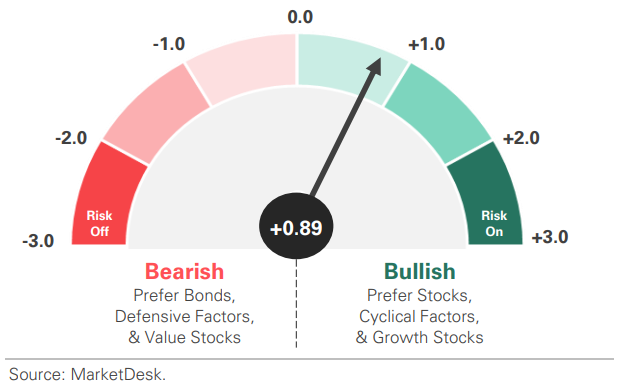
US Risk Demand Market Indicator
The US Risk Demand Indicator (USRDI) is a quantitative tool to measure real-time investor risk appetite. When the indicator is above zero, it signals a risk-on environment favoring cyclical sectors, high beta stocks, high-yield corporate bonds, and hybrid (convertible) bonds. In contrast, a reading below zero signals a risk-off environment favoring defensive sectors, low-volatility stocks, and US Treasury bonds.
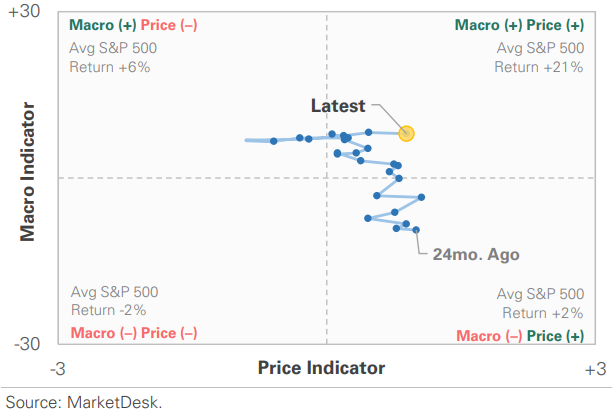
US Market Economic Cycle Indicator
The Market Cycle Indicator tracks two primary investor groups: macro investors and price-based investors. Macro investors rely on fundamental and economic data to guide their decisions, while price-based investors (or technical analysts) focus on price action, momentum, volume, and behavioral trends. The Indicator synthesizes these perspectives to identify the prevailing market regime.
S&P 500 Valuation Matrix

Key Takeaways
#1 - Retail Sales Rise
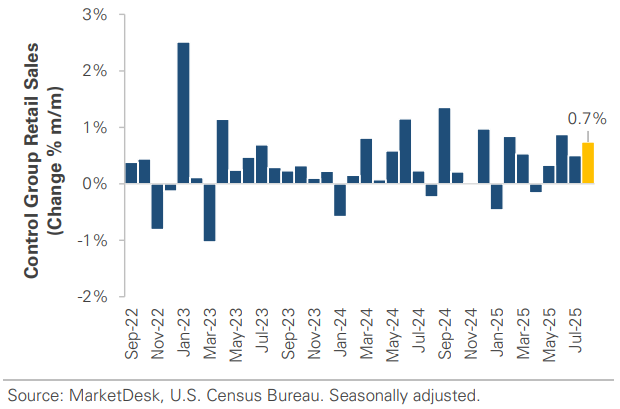
Retail sales rose a stronger-than-expected +0.6% in August, a third consecutive monthly gain. Core retail sales (ex. auto, gas, & food services) rose +0.7%, pointing to broad-based strength. The data signals a continued rebound from the spring slowdown, with June, July, and August rising more than +0.6%. However, concerns remain. Sales are reported in nominal terms, meaning inflation-adjusted growth is closer to 2% annualized. Spending is also uneven: discretionary goods like furniture remain weak, while online shopping and dining out are strong.
Implication: The past three months support a solid Q3 GDP outlook. The Atlanta Fed’s GDPNow is +3.3%, but sticky inflation, tariffs, and a soft labor market could test the consumer.
Retail Sales Point to Consumer Spending Rebound
#2 - Industrial Production Rises
Industrial production rose +0.1% in August, a modest bounce after July’s -0.4%. The gain was driven by a +2.6% surge in motor vehicles, which had declined in the prior two months. The manufacturing subindex rose +0.2%, but excluding autos, production was flat as utility output fell - 2.3%. Year-over-year, industrial production and manufacturing have expanded by ~ +1%.
Implication: The data suggests industrial activity may have found a floor, but momentum remains narrow. Until activity broadens, the sector will likely contribute little to GDP growth.
Industrial Production Stabilizes But Remains Sluggish

#3 - Housing Activity Slows
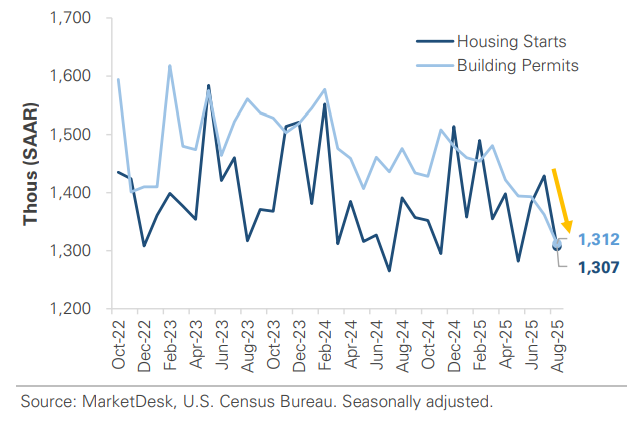
Housing activity slowed sharply in August, starting down 8.5% m/m and permits falling 3.7%. The decline was broad-based and led by single-family, where starts fell -7.0% and permits fell -2.2%, signaling weak demand despite a modest drop in mortgage rates. Multifamily permits also declined sharply, suggesting credit conditions remain tight for developers. While completions rose, the decline in permits and shrinking unit backlog signals further weakness.
Implication: The pullback in residential construction will likely weigh on GDP and constrain future supply, potentially increasing shelter inflation.
Housing Activity Slowed in August
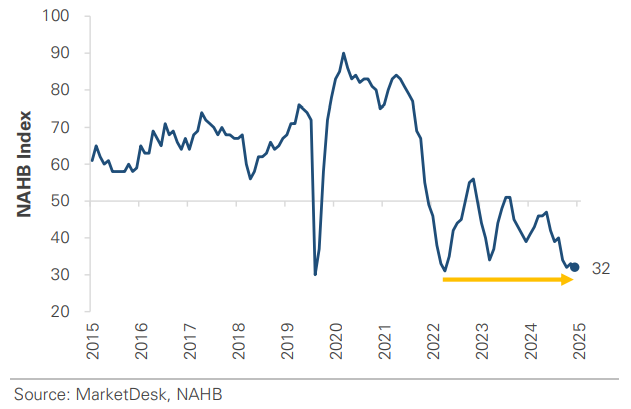
Homebuilder Sentitment Remains Weak
#4 - Fed Cuts Interest Rates
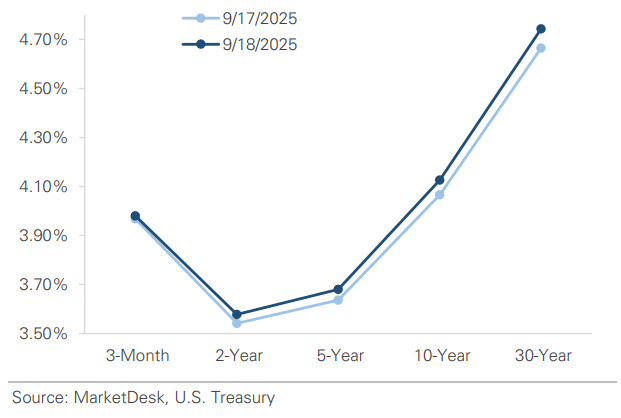
As anticipated, the Fed cut interest rates by -0.25% this week. Chair Powell called it a “risk management cut,” aimed at addressing slowing job growth while balancing above-target inflation. The updated Summary of Economic Projections shows expectations for two more cuts this year, which are in line with the market. However, the Fed’s median forecast includes just one rate cut in 2026, below the market’s expectation for three.
Implication: We see the cut as the start of a cautious easing cycle, with the Fed balancing labor and inflation risk. Powell’s “risk management” tone signals a slower, more measured path than the market forecasts.
Federal Reserve Resumes Rate-Cutting Cycle

Back End of Treasury Yield Curve Rises After Fed Cuts
Important Disclosures
This material is provided for general and educational purposes only and is not investment advice. Your investments should correspond to your financial needs, goals, and risk tolerance. Please consult an investment professional before making any investment or financial decisions or purchasing any financial, securities, or investment-related service or product, including any investment product or service described in these materials.
Our Insights


