Government Shutdown, Labor and Mfg. Data, Tariff Rhetoric, and AI Infrastructure Spending

Photo Credit: Joseph Gonzalez, Unsplash
Weekly Market Recap for October 3rd
This week, the markets ended higher, extending September’s momentum despite lingering macro uncertainties. The S&P 500 rose nearly +2% to another all-time high, led by health care, technology, and utilities gains, while energy and financials lagged. Small caps maintained their leadership and outperformed large caps, with the Equal Weight and Growth factors both modestly outperforming. International equities outpaced U.S. markets as the dollar softened, with emerging markets ahead of developed. Treasuries rallied on weaker labor data in fixed income, with longer maturities outperforming as interest rates fell. Corporate bonds also trade higher, with investment-grade outperforming high yield. Commodities diverged as crude oil fell to its lowest since early May, while gold extended its record-setting rally.
S&P 500 Index (Last 12 Months)

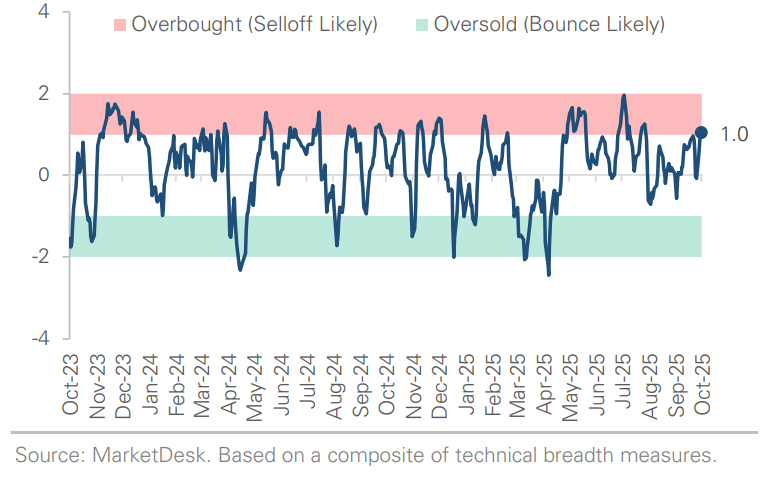
S&P 500 Technical Composite (Last 24 Months)
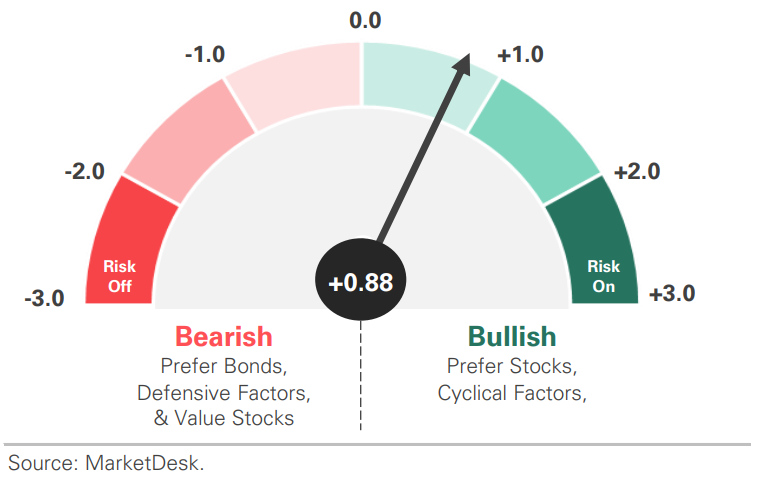
US Risk Demand Market Indicator
The US Risk Demand Indicator (USRDI) is a quantitative tool to measure real-time investor risk appetite. When the indicator is above zero, it signals a risk-on environment favoring cyclical sectors, high beta stocks, high-yield corporate bonds, and hybrid (convertible) bonds. In contrast, a reading below zero signals a risk-off environment favoring defensive sectors, low-volatility stocks, and US Treasury bonds.
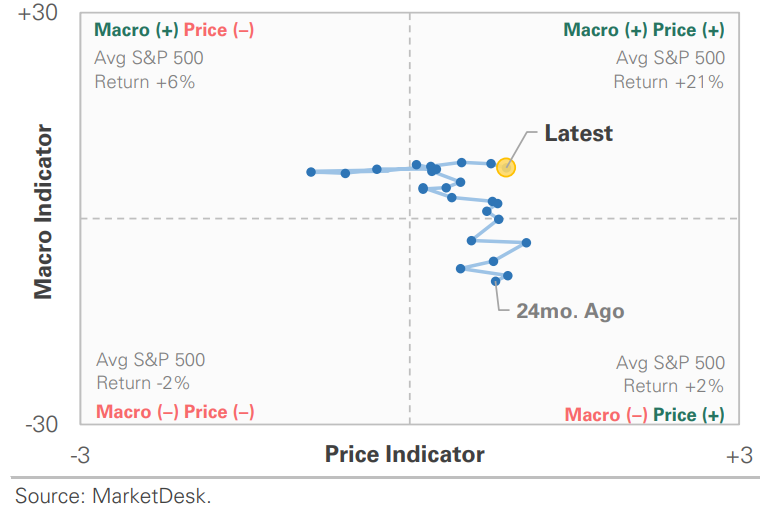
US Market Economic Cycle Indicator
The Market Cycle Indicator tracks two primary investor groups: macro investors and price-based investors. Macro investors rely on fundamental and economic data to guide their decisions, while price-based investors (or technical analysts) focus on price action, momentum, volume, and behavioral trends. The Indicator synthesizes these perspectives to identify the prevailing market regime.
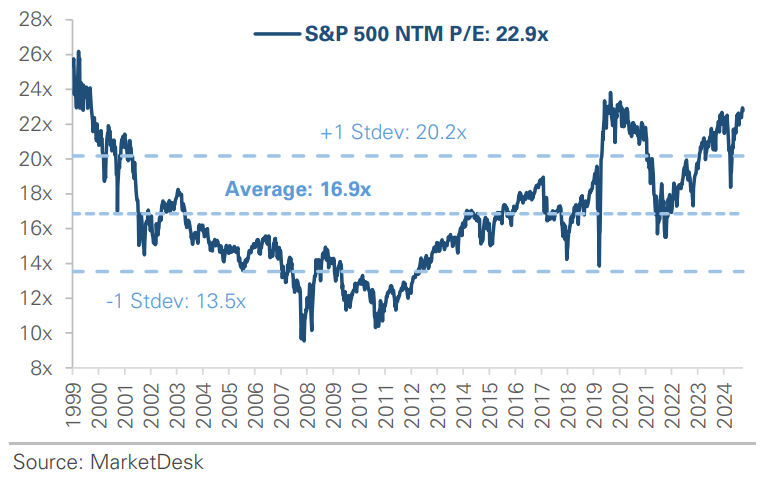
S&P 500 Valuation Matrix
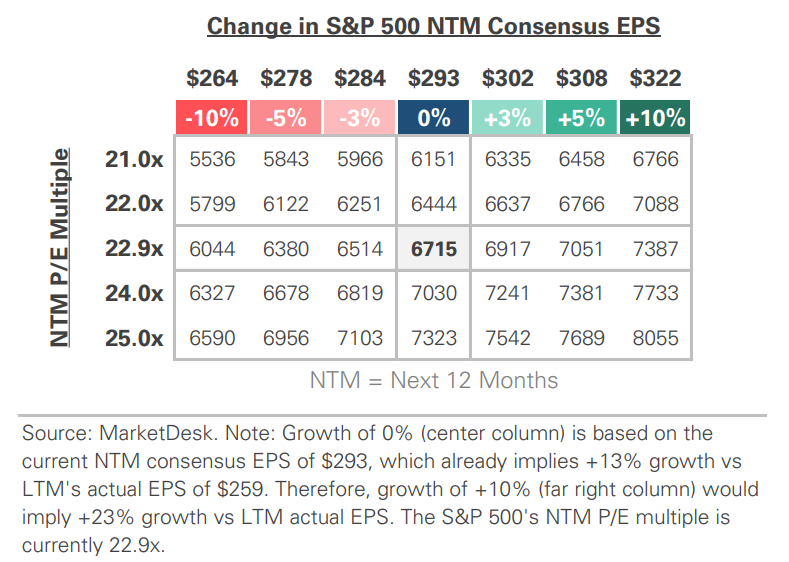
S&P 500 Forward PE Ratio
The S&P 500 forward price-to-earnings (P/E) ratio is a widely followed valuation metric that compares the index's current level to the projected earnings of its constituent companies over the next 12 months. The indicator implies to investors how much they are paying today for each dollar of expected future earnings.
Key Takeaways
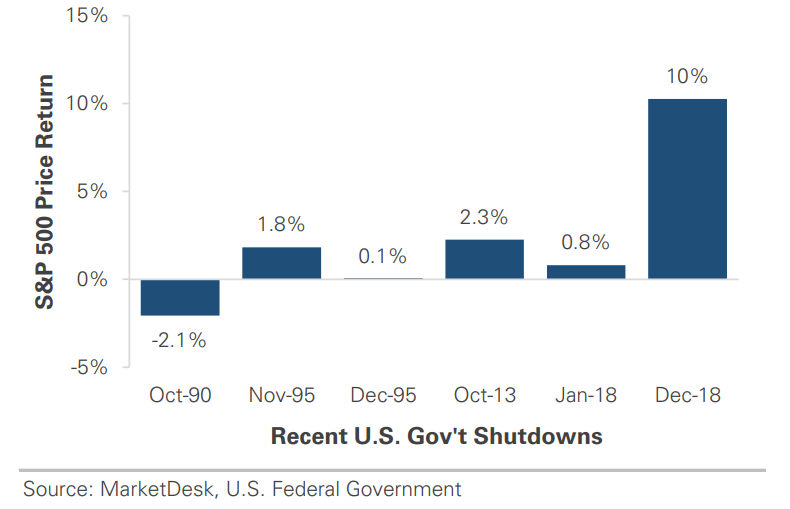
#1 - The Federal Government Officially Shut Down
After lawmakers failed to pass a funding resolution, the federal government shut down for the first time since 2018. Here are the relevant statistics around prior shutdowns. While most shutdowns lasted less than 5 days before the 1990s, the past three major ones lasted 21, 16, and 35 days. From a market perspective, shutdowns have historically been a non-event.
Implication: The market initially brushed off the news, but prolonged gridlock could weigh on investor confidence.
US Government Shutdowns Have Become Longer

Markets See Shutdowns as Non-Events
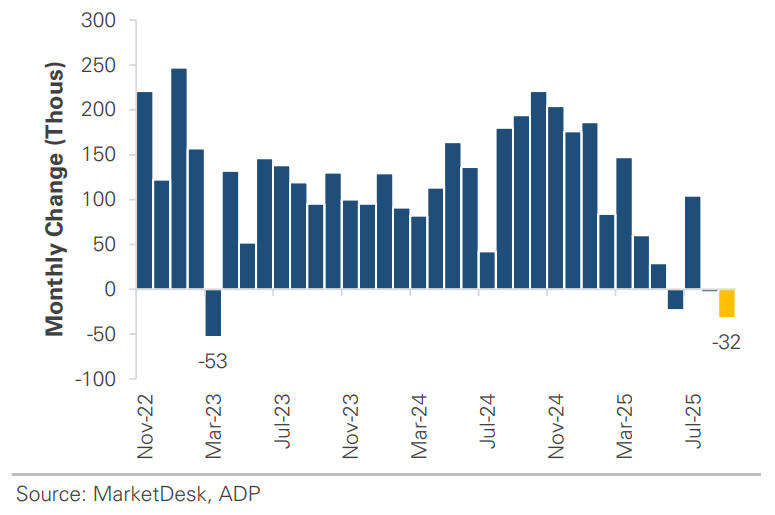
#2 - Labor Market Data Remains Weak
ADP private payrolls fell by -32,000 in September, the weakest since early 2023. While the number of job openings rose, the quit rate fell to the lowest since December, indicating workers feel less confident about their job prospects.
Implication: The latest labor data supports a gradually cooling economy narrative, giving the Fed more room to cut rates even as overall growth remains strong.
Labor Market Data Remains Soft
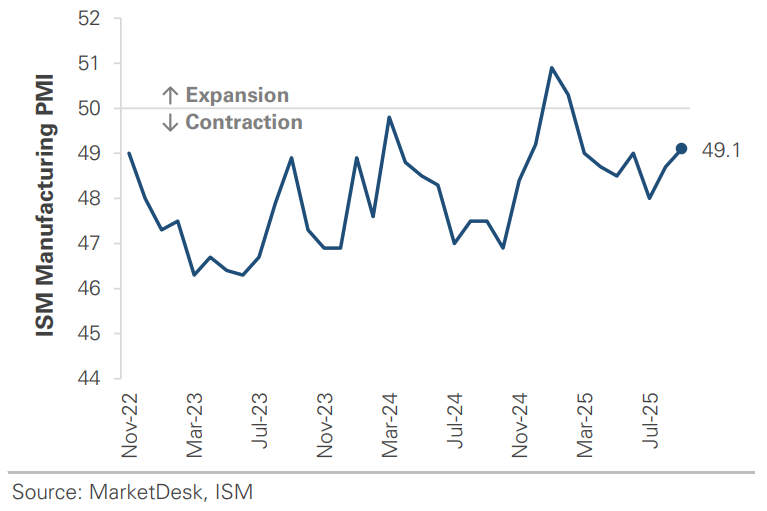
#3 - Manufacturing Data Also Weak
Multiple regional and national surveys signaled contraction, with respondent commentary highlighting deteriorating demand and weak new orders. Manufacturing continues to act as a drag on growth, and until new orders and production recover, the sector is unlikely to contribute to economic growth.
Implication: The sector's persistent weakness reinforces the narrative of a two-speed economy, where services remain resilient while goods-producing industries struggle.
Manufacturing Contracts
#4 - Tariff Rhetoric Resurfaces
The administration is pushing new levies on pharmaceuticals, heavy-duty trucks, and housing products. Officials indicated they would pursue alternative legal avenues to maintain their policy stance if existing tariffs face court challenges.
Implication: Trade uncertainty continues to linger but has not hurt investor sentiment.
#5 - AI Infrastructure Spending Keeps Climbing
Multiple AI deals and partnerships were announced this week. CoreWeave announced a $14 billion agreement with Meta to provide computing power, while several Asian semiconductor firms signed contracts to supply chips for OpenAI’s Stargate data center.
Implication: These deals reinforce expectations that big tech companies will continue to drive capex spending across the AI supply chain in the coming years.
#6 - Financial Sector Underperforms
Banks and asset managers underperformed the market this week amid concerns over credit quality, market liquidity, and declining fee income. There has been an uptick in bankruptcies recently, and while the cases are idiosyncratic, they have raised concerns about growing stress and leverage in corporate credit.
Financial Sector Lags The Broader Market

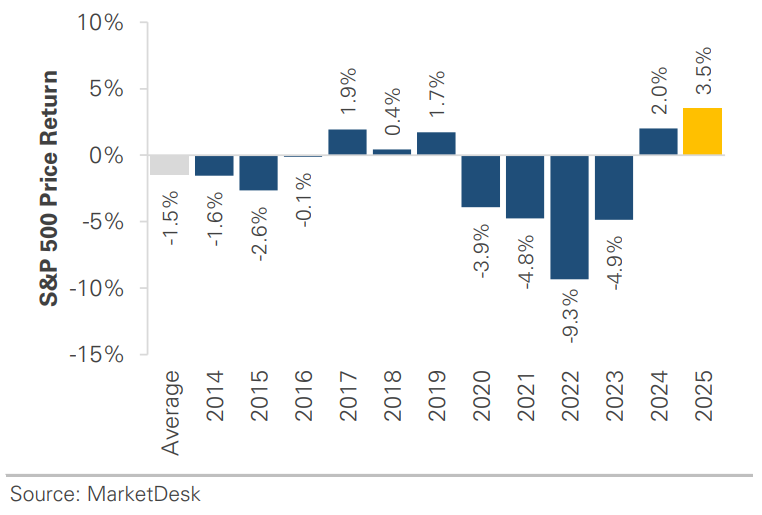
#7 - Equities Finish On A Strong Note
The S&P 500 gained +3.5% and posted its fifth consecutive monthly gain. The September gain defies what is typically a seasonally weak time of year. Despite softer labor data, the rally was driven by Fed easing, resilient consumer demand, and AI enthusiasm.
Implication: The strength heading into Q4 highlights how rate-cut expectations and the AI narrative continue to overpower seasonal headwinds.
September Stock Market Gains Defy Weak Seasonality
Important Disclosures
This material is provided for general and educational purposes only and is not investment advice. Your investments should correspond to your financial needs, goals, and risk tolerance. Please consult an investment professional before making any investment or financial decisions or purchasing any financial, securities, or investment-related service or product, including any investment product or service described in these materials.
Our Insights