Goods and Services Activity Diverge, Labor Conditions Soften, and Market Leadership Broadens

Photo Credit: Denys Nevozhai, Unsplash
Weekly Market Recap for January 9th
This week, markets started 2026 on a positive note, with major equity indices extending their 2025 gains as leadership shifted to smaller companies and cyclical sectors. Meanwhile, the bond market was quiet, producing modest gains as Treasury yields inched lower, while corporate bonds outperformed amid tight credit spreads. Reflecting this environment, the tone across financial markets was risk-on but hedged, with bitcoin and gold trading higher alongside equities. Economic data further reinforced the picture of a two-speed economy, showing divergent activity across goods and services alongside softer labor conditions. Against this backdrop, the dominant market narrative centers on a soft landing, where the economy slows but avoids a recession, and on the growth potential of the AI industry. Looking ahead, the main questions are whether stock market leadership will continue to broaden and how much further the Fed will cut interest rates.
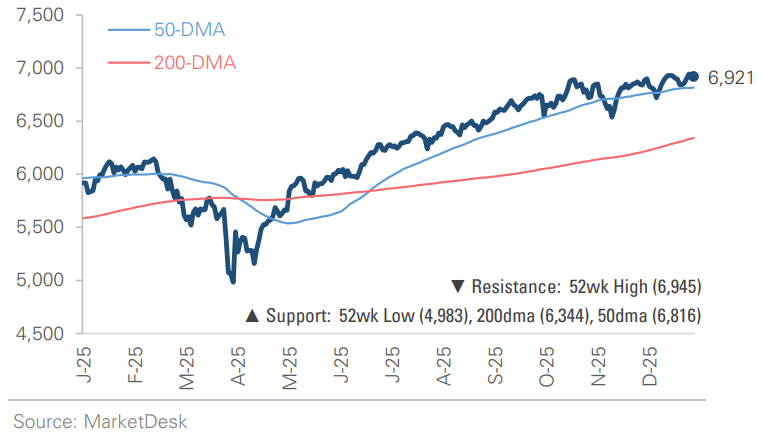
S&P 500 Index (Last 12 Months)
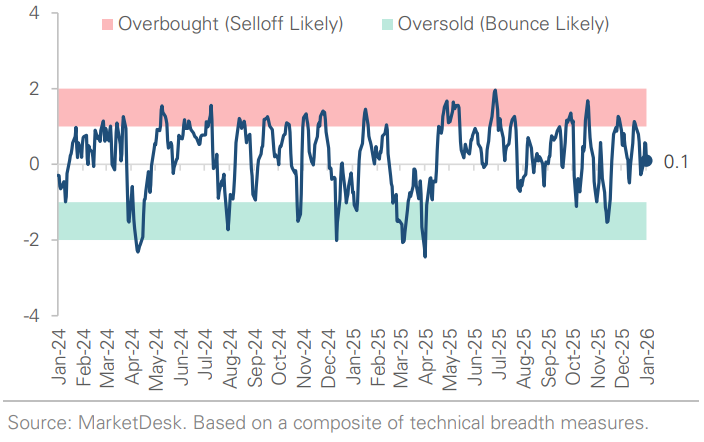
S&P 500 Technical Composite (Last 24 Months)
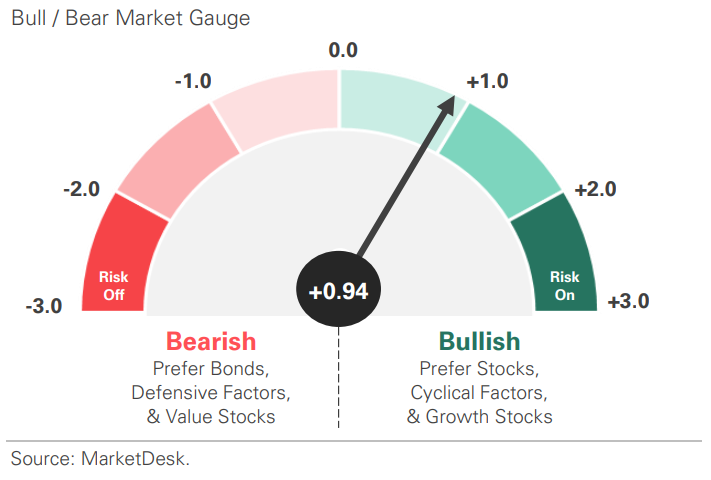
US Risk Demand Market Indicator
The US Risk Demand Indicator (USRDI) is a quantitative tool to measure real-time investor risk appetite. When the indicator is above zero, it signals a risk-on environment favoring cyclical sectors, high beta stocks, high-yield corporate bonds, and hybrid (convertible) bonds. In contrast, a reading below zero signals a risk-off environment favoring defensive sectors, low-volatility stocks, and US Treasury bonds.
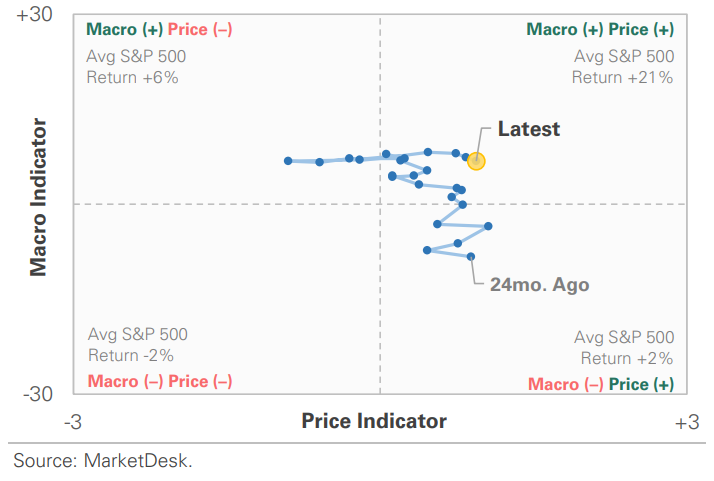
US Market Economic Cycle Indicator
The Market Cycle Indicator tracks two primary investor groups: macro investors and price-based investors. Macro investors rely on fundamental and economic data to guide their decisions, while price-based investors (or technical analysts) focus on price action, momentum, volume, and behavioral trends. The Indicator synthesizes these perspectives to identify the prevailing market regime.
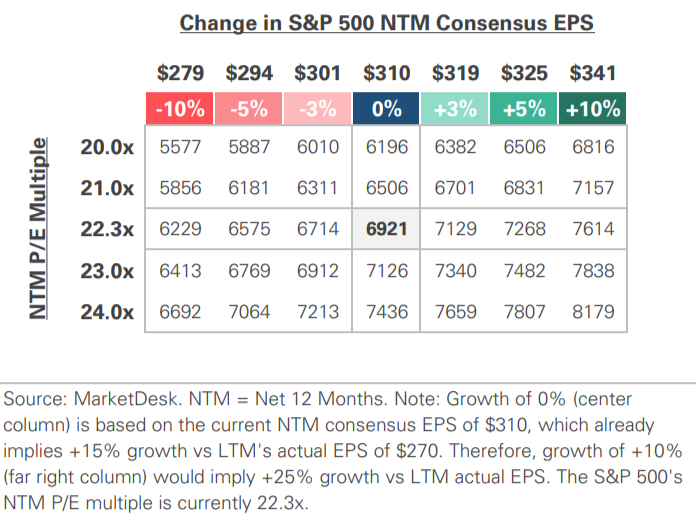
S&P 500 Valuation Matrix
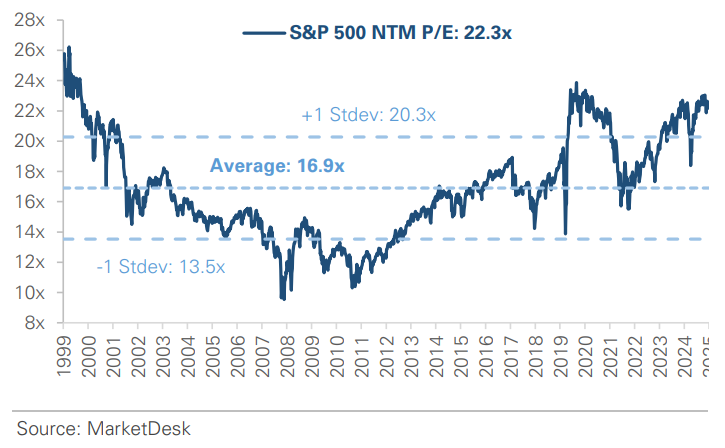
S&P 500 Forward PE Ratio
The S&P 500 forward price-to-earnings (P/E) ratio is a widely followed valuation metric that compares the index's current level to the projected earnings of its constituent companies over the next 12 months. The indicator implies to investors how much they are paying today for each dollar of expected future earnings.
Key Takeaways
#1 - The Economic Divide Between Goods And Services
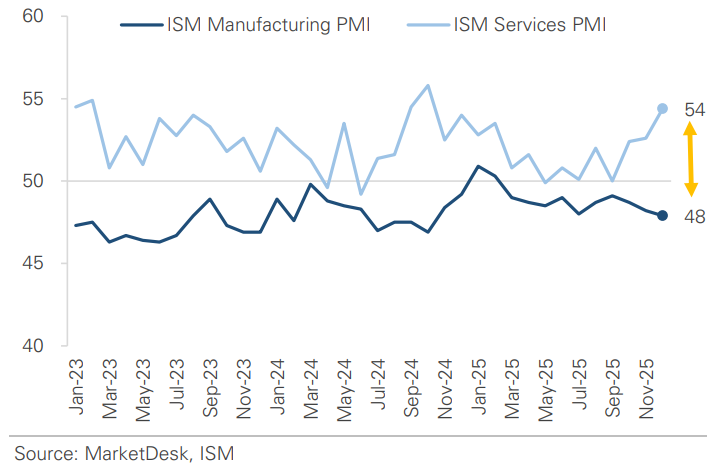
This week’s economic data reinforced the divide between the goods and services sectors. The ISM Manufacturing Survey remained below 50, indicating a 10th consecutive month of contraction and underscoring the sluggish state of the manufacturing sector (Figure 1). In contrast, the ISM Services Survey rose from the prior month, indicating the services sector continues to expand.
Implication: The data support the view of a two-speed economy, with goods and manufacturing lagging while services-driven growth remains strong.
Goods and Services Activity
#2 - Labor Data Gradually Softening
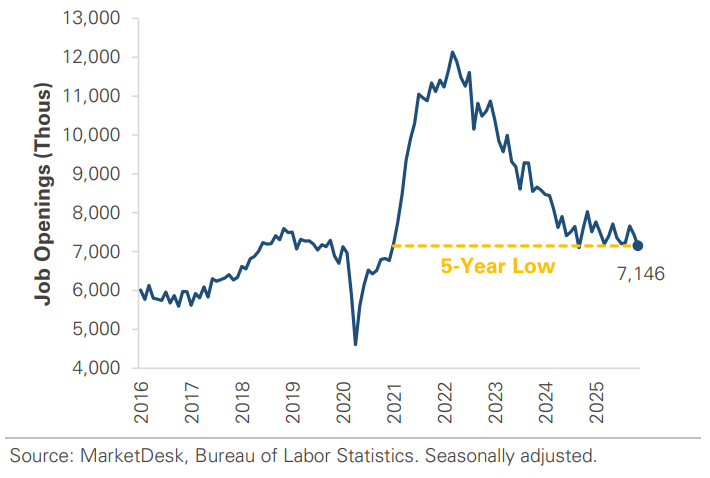
This week’s labor data points to continued, gradual softening. ADP’s payroll report showed the U.S. added +41,000 jobs in December, up from November’s -29,000. Despite the rebound, the data represent a continuation of the slowdown in 2025, with job growth still well below levels from 2023 and 2024. Meanwhile, the number of job openings fell from 7.45 million to 7.15 million, among the lowest since early 2021
Implication: The labor market is gradually rebalancing, with fewer openings but continued job growth. Economists continue to characterize labor conditions as “low-hire, low-fire.”
Job Openings Fall to a 5-Year Low
#3 - The Stock Market Signals Rotation and Shift in Leadership
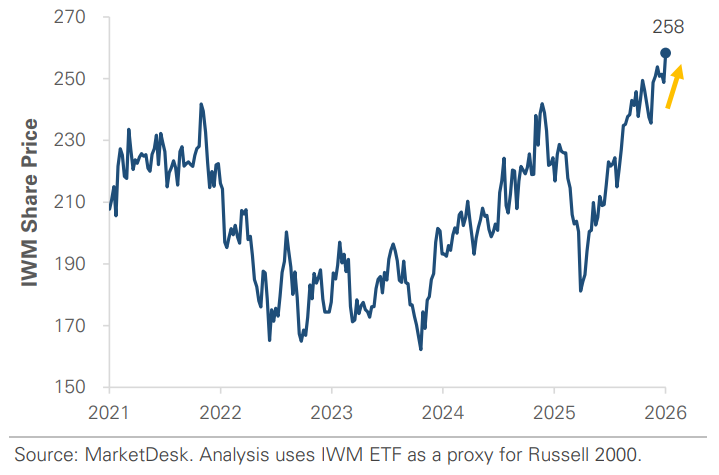
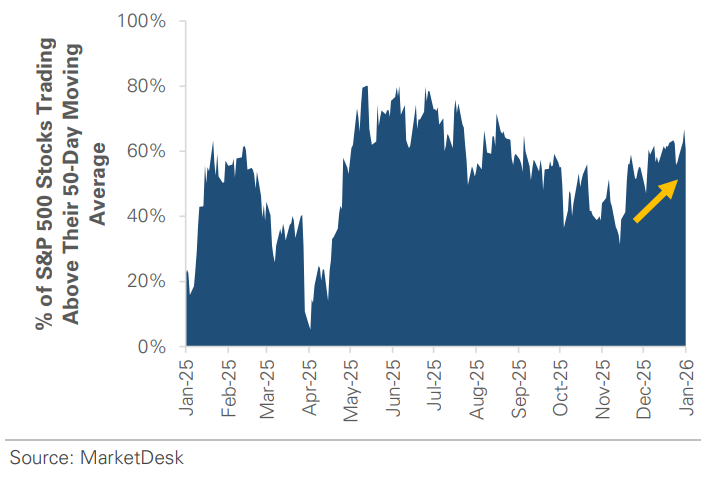
The S&P 500 and Nasdaq both gained around +1%, but their returns were overshadowed. Small-cap stocks led the advance, with the Russell 2000 surging by nearly 5% and setting a new high. Leadership broadened across style exposures, with Large-Cap Value and S&P 500 Equal Weight both gaining more than 2.5%. In contrast, large-cap growth ended the week flat, while the technology sector ended with a modest gain. Market breadth improved alongside the rotation. The share of S&P 500 stocks trading above their 50-day moving averages, a key measure of technical strength and participation, increased from 55% to 60%
Implication: Market gains over the past two years were driven by a narrow group of mega-cap stocks. This week’s rotation signals an improving breadth and more balanced leadership as we enter 2026.
Small Cap Stocks Trade to New Highs to Start 2026
Stock Market Breadth Continues to Improve
#4 -Demand for Hedges
There was demand for hedges this week, even as stocks and bonds traded higher. Gold is up nearly +3% year-to-date and trading higher with equities, despite stocks setting new highs to start the year. Similarly, the VIX remains in the mid-teens but has drifted higher since the beginning of the year
Implication: Market price action signals robust risk appetite, but demand for hedges shows investors remain cautious.
#5 - Geopolitical Developments in Venezuela
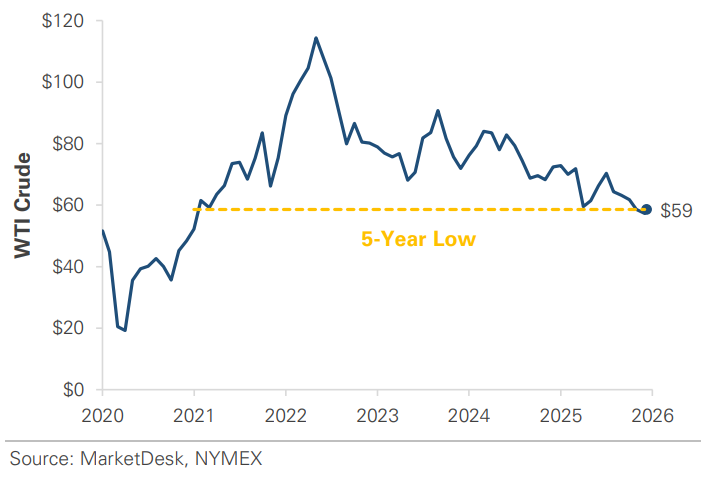
Geopolitical developments in Venezuela shaped oil and energy trading this week. Oil traded higher early in the week but reversed lower later as talk of Venezuelan oil raised oversupply concerns. Inventory data added pressure on oil prices as gasoline inventories increased.
Implication: Oil prices trade near five-year lows despite elevated geopolitical risk, underscoring persistent oversupply concerns. Lower oil prices help ease inflation pressures and could continue to support consumer spending.
Oil Trades Near a 5-Year Low
Important Disclosures
This material is provided for general and educational purposes only and is not investment advice. Your investments should correspond to your financial needs, goals, and risk tolerance. Please consult an investment professional before making any investment or financial decisions or purchasing any financial, securities, or investment-related service or product, including any investment product or service described in these materials.
Our Insights


