Inflation Remains Elevated, and Labor Market Improves

Photo Credit: Getty, Unsplash
Weekly Market Recap for June 12th
This week, markets fell for a second straight week, pausing a nearly two-month rally that began in late March. The market’s recent winners, particularly the tech sector and growth stocks, continued to lead the selloff. Weakness in mega-cap tech weighed on the S&P 500 and Nasdaq, while small caps, value stocks, and the equal-weight factor held up better. Defensive sectors led this week, and 10 of 11 S&P 500 sectors beat the index, a reversal from recent weeks, when tech drove most of the gains. Treasury yields ended the week lower as oil prices fell on headlines of a diplomatic resolution, even though headline inflation came in higher than expected. Bonds traded higher as yields fell, with longer-maturity bonds outperforming. Commodities moved lower as oil declined more than -6%, and bitcoin stabilized after falling to $60,000 last week.
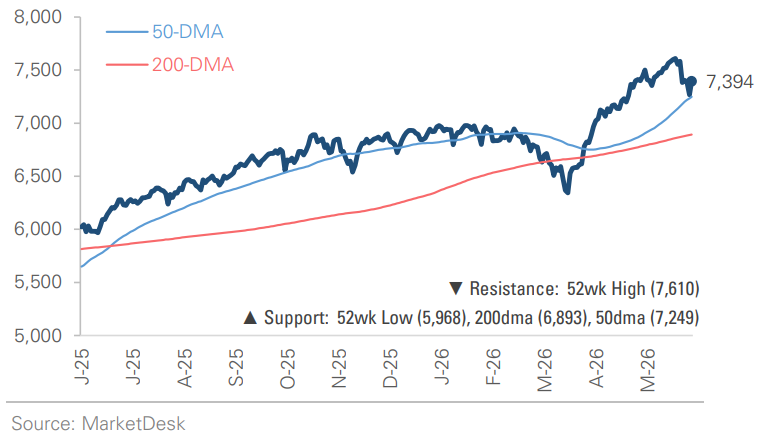
S&P 500 Index (Last 12 Months)
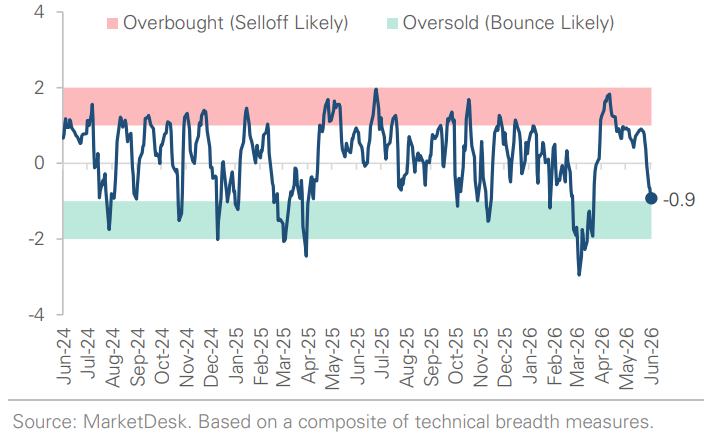
S&P 500 Technical Composite (Last 24 Months)
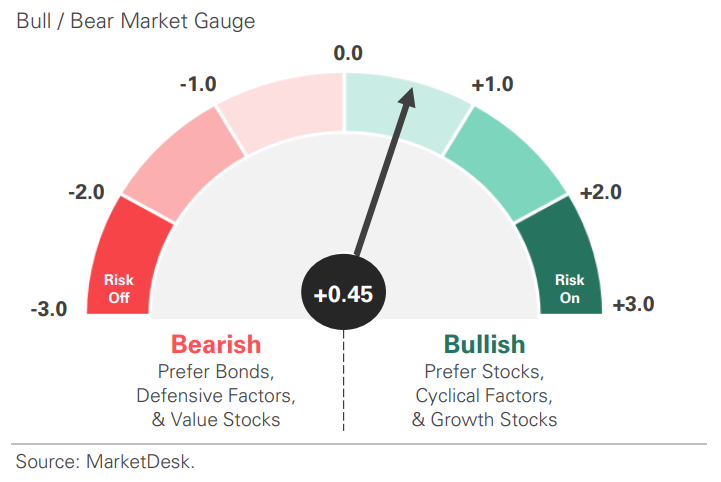
US Risk Demand Market Indicator
The US Risk Demand Indicator (USRDI) is a quantitative tool to measure real-time investor risk appetite. When the indicator is above zero, it signals a risk-on environment favoring cyclical sectors, high beta stocks, high-yield corporate bonds, and hybrid (convertible) bonds. In contrast, a reading below zero signals a risk-off environment favoring defensive sectors, low-volatility stocks, and US Treasury bonds.
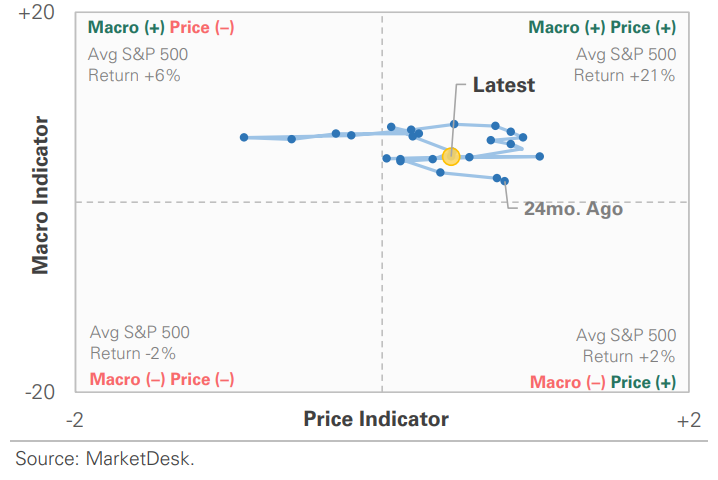
US Market Economic Cycle Indicator
The Market Cycle Indicator tracks two primary investor groups: macro investors and price-based investors. Macro investors rely on fundamental and economic data to guide their decisions, while price-based investors (or technical analysts) focus on price action, momentum, volume, and behavioral trends. The Indicator synthesizes these perspectives to identify the prevailing market regime.
S&P 500 Valuation Matrix
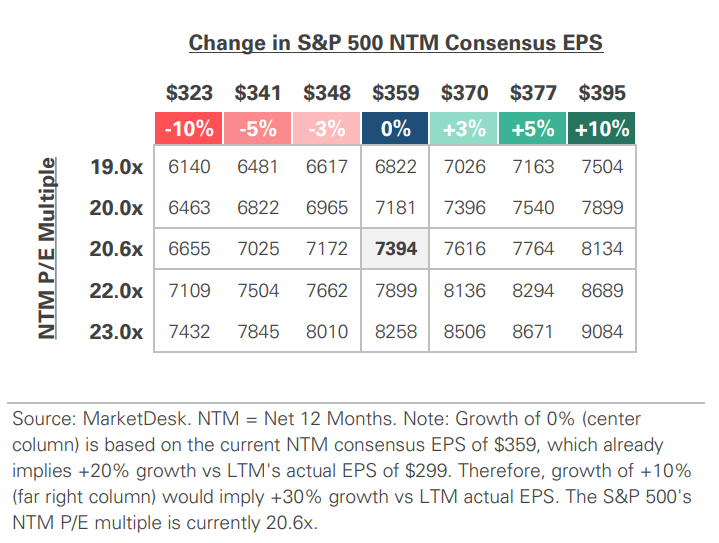
S&P 500 Forward PE Ratio
The S&P 500 forward price-to-earnings (P/E) ratio is a widely followed valuation metric that compares the index's current level to the projected earnings of its constituent companies over the next 12 months. The indicator implies to investors how much they are paying today for each dollar of expected future earnings.

Key Takeaways
#1 - S&P 500 and NASDAQ At Record Highs
The S&P 500 and Nasdaq opened June at fresh record highs but have each given back roughly -5% over the past few weeks. Despite the headline selloff, the pullback has been narrower and shallower than it appears. Technology and semiconductor stocks have led both the recent rally and this month’s pullback, and there have been signs of rotations to small caps and the equal-weight S&P 500, with market breadth holding steady.
Implication: Pullbacks after record highs are normal and do not mean anything is broken, but they are a reminder that gains concentrated in a few sectors can cut both ways.
Tech Sector Rebounds After Last Week’s Selloff

#2 - Inflation Climbs To 3 Year High
Inflation climbed to a three-year high last month. Consumer prices rose 4.2% year-over-year in May, the fastest annual pace since 2023, up from April’s 3.8%. Energy accounted for more than 60% of the monthly increase, with gasoline up about 7% during the month and ~40% over the past year. The story underneath the headline was calmer. Core inflation, which removes food and energy, slowed to +2.9% and rose just +0.2% month-over-month, slightly below forecast. Shelter inflation, a large and sticky piece of the basket, also continues to ease. The gap between a hot headline and a steadier core suggests the spike is concentrated in fuel for now.
Implication: Inflation sits above the Fed’s target as energy prices remain elevated. The market and the Fed continue to watch for signs that the pressure is spreading beyond energy.
Energy Prices are Keeping Headline CPI Elevated

Core CPI Holds Steady

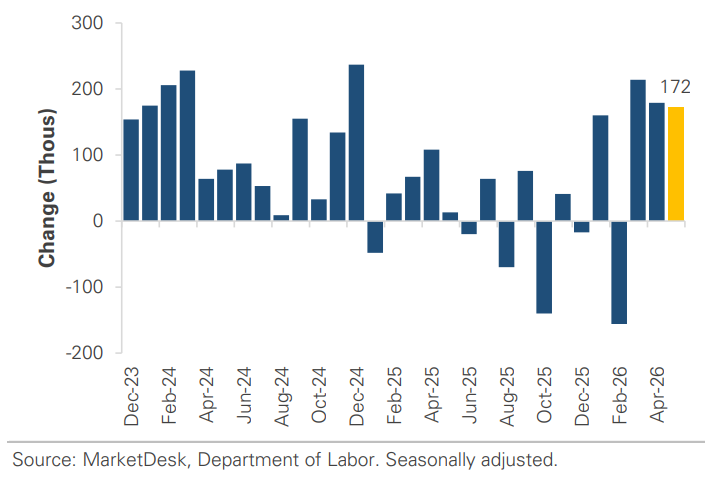
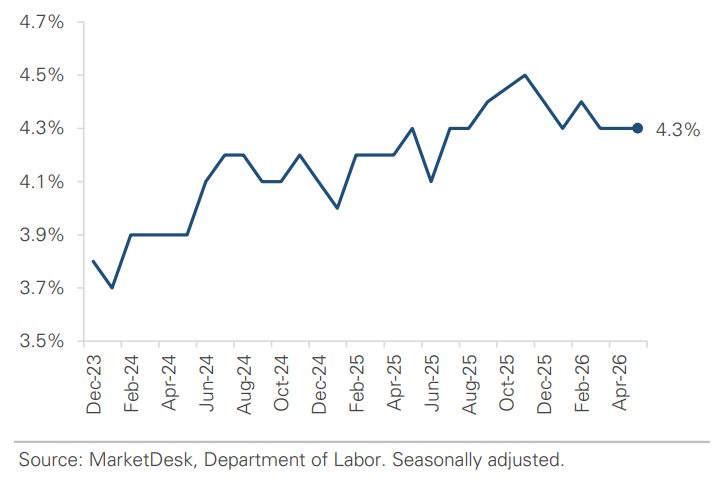
#3 - Job Growth Exceeds Expectations
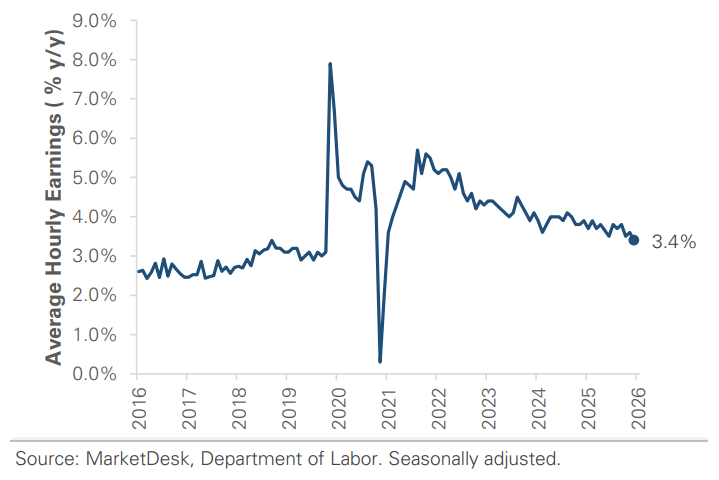
Employers added +172,000 jobs in May, more than double expectations, and the unemployment rate held at 4.3%. Hiring for the prior two months was revised higher by a combined +93,000, but there are signs of labor market slack. The job gains were concentrated in a handful of industries, the ranks of the long-term unemployed remain elevated compared to a year ago, and wage growth cooled to +3.4% year-over-year.
Implication: The labor market continues to improve after slowing in late 2025, but some softness is starting to show in the data. The Fed will need to balance the labor market against inflation, which remains elevated.
Job Growth Continues to Improve After Q4 Slowdown
Unemployment Holds Steady at 4.3%
Hourly Wage Growth Continues To Normalize
#4 -Oil And Iran Continue To Impact The Market
Oil and the Iran conflict continue to impact the energy market. Renewed military strikes this week and ongoing shipping disruptions in the Strait of Hormuz, a critical waterway for global oil trade, are keeping prices high even though oil is well below its spring peak. The latest strikes spared energy infrastructure, which kept prices from climbing further, but oil remains near $90 per barrel and well above where it traded a year ago.
Implication: The conflict is the thread running through the week’s inflation headlines: oil is the main force pushing inflation up, and the variable that could pull it back down.
#5 - First Fed Meeting Chaired By Kevin Warsh
The Fed meets next week, its first meeting chaired by Kevin Warsh. The market expects the Fed to hold rates steady at both the June and July meetings. This week’s inflation data and the continued Middle East conflict, however, are reshaping the outlook for later this year. The conversation has shifted from when the Fed might cut rates to when it might raise them, with the market now leaning toward a rate increase in the fourth quarter. The longer the Strait of Hormuz remains disrupted, the more likely that becomes.
Implication: Interest rate expectations affect mortgages, savings yields, and bond and stock valuations, so the Fed’s tone and outlook could set the market’s direction in the coming months.
Important Disclosures
This material is provided for general and educational purposes only and is not investment advice. Your investments should correspond to your financial needs, goals, and risk tolerance. Please consult an investment professional before making any investment or financial decisions or purchasing any financial, securities, or investment-related service or product, including any investment product or service described in these materials.
Our Insights