Inflation Data, GDP Growth Revised Lower, and Stocks Set New Highs as Oil Prices Decline

Photo Credit: Pierre Chatel Innocenti, Unsplash
Weekly Market Recap for May 29th
This week, stocks extended their winning streak, setting fresh records almost daily. The S&P 500, Nasdaq, and Dow each closed at new all-time highs, and the rally showed signs of broadening, with small caps and the equal-weight index participating more than they had in recent weeks. Technology remained the performing sector, pulling both the market-cap-weighted index and growth stocks higher. Defensive sectors and energy lagged as the market rallied on diplomatic progress in the Middle East. Falling oil prices sent Treasury yields reversing lower after their recent climb, and the decline in interest rates offered relief to bonds. Market volatility eased as well, with the VIX drifting lower as geopolitical tensions cooled and stocks pushed higher.
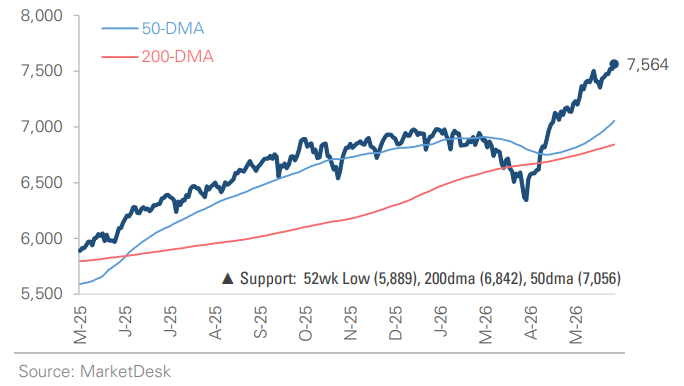
S&P 500 Index (Last 12 Months)
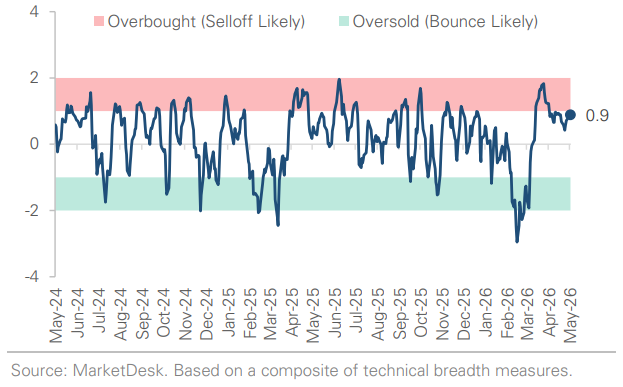
S&P 500 Technical Composite (Last 24 Months)
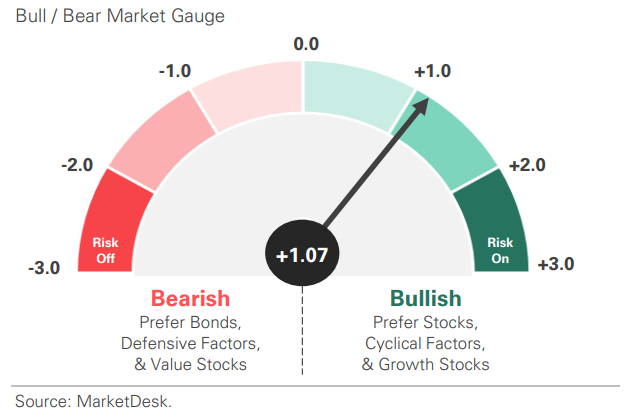
US Risk Demand Market Indicator
The US Risk Demand Indicator (USRDI) is a quantitative tool to measure real-time investor risk appetite. When the indicator is above zero, it signals a risk-on environment favoring cyclical sectors, high beta stocks, high-yield corporate bonds, and hybrid (convertible) bonds. In contrast, a reading below zero signals a risk-off environment favoring defensive sectors, low-volatility stocks, and US Treasury bonds.
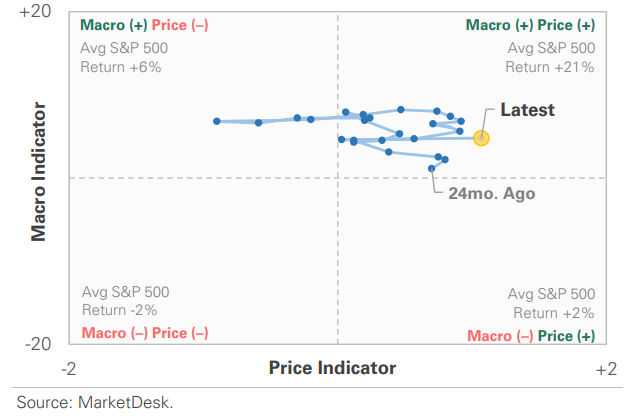
US Market Economic Cycle Indicator
The Market Cycle Indicator tracks two primary investor groups: macro investors and price-based investors. Macro investors rely on fundamental and economic data to guide their decisions, while price-based investors (or technical analysts) focus on price action, momentum, volume, and behavioral trends. The Indicator synthesizes these perspectives to identify the prevailing market regime.
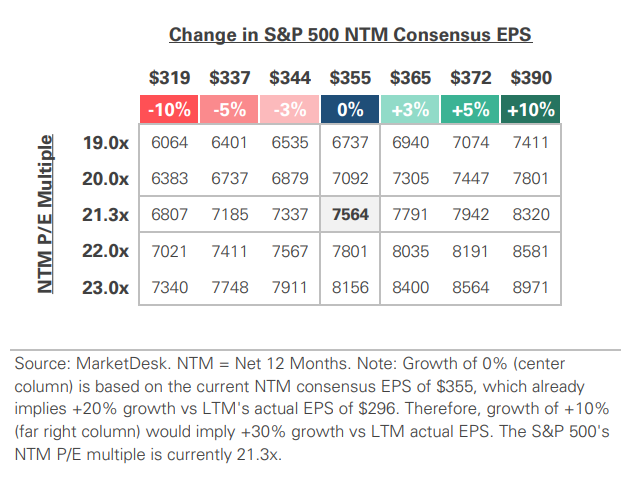
S&P 500 Valuation Matrix
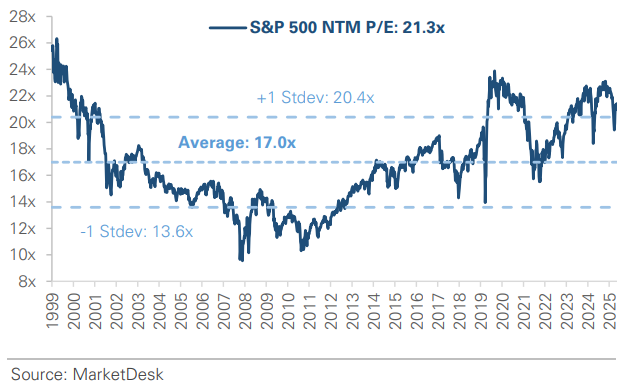
S&P 500 Forward PE Ratio
The S&P 500 forward price-to-earnings (P/E) ratio is a widely followed valuation metric that compares the index's current level to the projected earnings of its constituent companies over the next 12 months. The indicator implies to investors how much they are paying today for each dollar of expected future earnings.
Key Takeaways
#1 - Inflation Remains Elevated
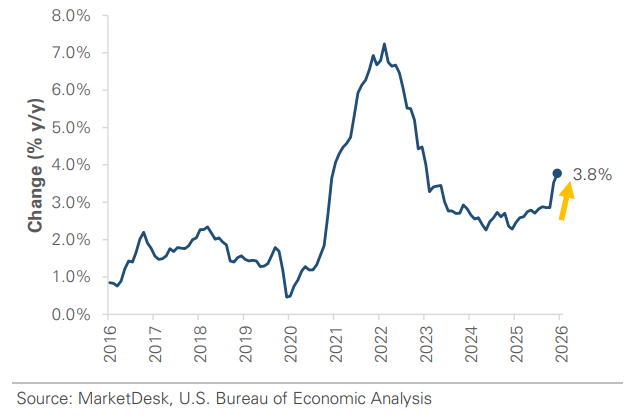
Inflation remains elevated, but the monthly pace cooled last month. The April PCE price index, the Fed’s preferred inflation measure, rose 3.8% year-over-year, the highest since May 2023, but the monthly rise of 0.4% was below the 0.5% forecast and slowed from March’s 0.7%. Energy prices tied to the ongoing disruption of oil traffic in the Strait of Hormuz drove much of the headline figure. Core PCE, which strips out the food and energy categories, rose just +0.2% on the month, below the +0.3% consensus, with the annual rate edging up from +3.2% to +3.3%.
Implication: The energy shock is still pushing the annual rate higher, but the softer monthly core reading suggests it has not yet spread broadly through the economy. Investors will be watching upcoming inflation data for signs that price pressures are widening beyond energy.
Inflation Pressures Remain Elevated
#2 - Q1 Economic Growth Slower
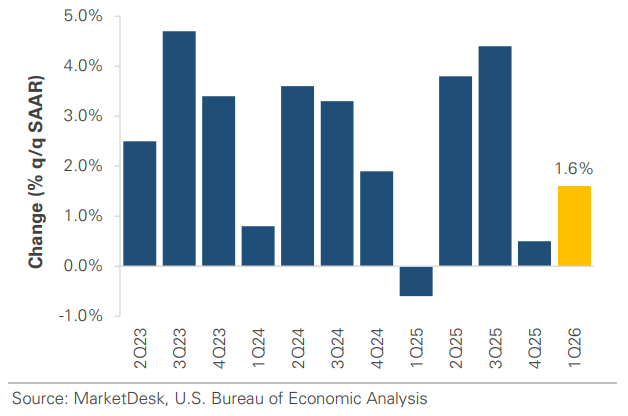
Economic growth in Q1 was slower than first estimated. The second estimate of first-quarter GDP was revised down to a +1.6% annualized pace from the initial +2% reading. The growth downgrade landed the same morning as the hot inflation print, sharpening the contrast between cooling growth and sticky prices.
Implication: Growth rebounded in Q1 following the Q4 government shutdown, but the combination of slower growth and elevated inflation could raise concerns about stagflation. That environment would complicate the Fed’s ability to respond, since cutting rates to support growth risks adding fuel to inflation.
GDP Growth Revised Lower
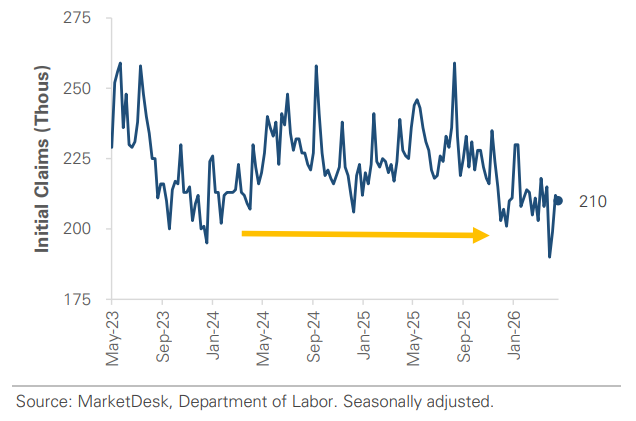
Initial Jobless Claims Remain Low
#3 - Major Indexes Set New Highs
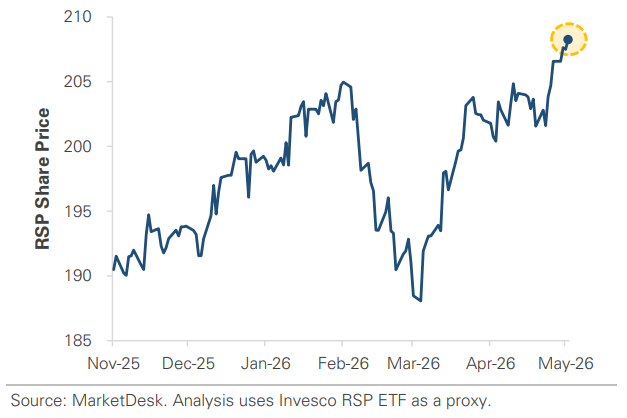
Major indexes continued to set new highs this week. The Dow, S&P 500, and Nasdaq each set new highs, extending their rallies from late March. The equity market rally was broad, with small caps and the equal-weight factor setting new highs.
Implication: Mega-cap stocks and the tech sector have driven most of the rally from late March’s lows. The rally has been narrow at times, but recent gains in the Dow, small caps, and the equal-weight factor signal improving breadth.
Equal Weight S&P 500 Sets New All-Time High
#4 -Middle East Headlines
The Middle East headlines continued to move oil and sentiment this week. Iran said it had a preliminary agreement to extend the ceasefire and guarantee shipping through the Strait of Hormuz, briefly sparking risk-on moves, before U.S. officials called the document a fabrication. Later in the week, headlines of a ceasefire agreement sent stocks toward new all-time highs. Oil prices retreated over the week, with crude trading near $90 and on track for a second straight weekly decline as markets bet on an eventual deal.
Implication: The Strait of Hormuz remains the single biggest wildcard for energy prices and inflation. Genuine de-escalation would provide a tailwind, but as this week shows, the headlines remain volatile and uncertain.
Oil Falls Below $90 Per Barrel

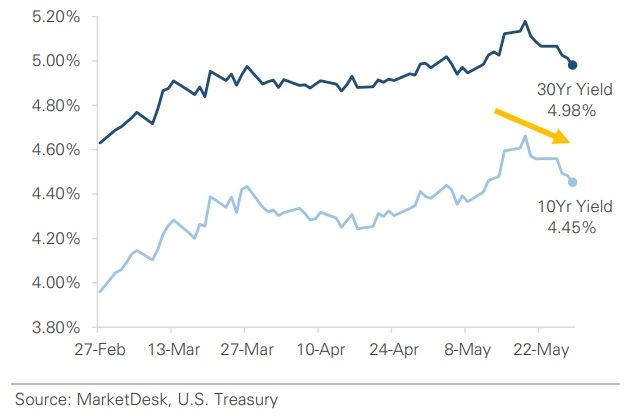
Treasury Yields Reverse Lower as Oil Declines
#5 - Interest Rates
Interest rates reversed lower as oil prices retreated. Treasury yields had climbed sharply in recent weeks, with the 30-year yield reaching a two-decade high as the oil spike stoked inflation fears. The pressure eased this week as crude pulled back: the 10-year yield fell to around 4.45%, and the 30-year fell below 5.00%. The move tracked Middle East de-escalation, where reported progress toward reopening the Strait of Hormuz pulled oil lower and, with it, the inflation premium built into bonds.
Implication: The recent path of interest rates has been tied closely to oil and the conflict. The reversal relieved pressure across bonds, mortgages, and rate-sensitive markets, but that relief likely depends on oil remaining contained and on diplomatic progress in the Middle East.
Important Disclosures
This material is provided for general and educational purposes only and is not investment advice. Your investments should correspond to your financial needs, goals, and risk tolerance. Please consult an investment professional before making any investment or financial decisions or purchasing any financial, securities, or investment-related service or product, including any investment product or service described in these materials.
Our Insights