Middle East Ceasefire Agreement, Oil Decline, Equity Rally, and Q1 Earnings Season Kickoff

Photo Credit: Getty, Unsplash
Weekly Market Recap for April 10th
This week, stocks traded higher for a second consecutive week as de-escalation triggered the strongest single-day rally in a year. The S&P 500 gained +3.7%, with the Nasdaq and the Russell 2000 both returning +4.3%. Most of the rally took place on Wednesday, after the announcement of a two-week ceasefire contingent on Iran reopening the Strait of Hormuz. Oil plunged 11%, the VIX dropped below 20, and international stocks rose as energy-importing nations benefited from the reversal in oil prices. Industrials were the top-performing sector, up 5%, with broad-based strength across most sectors, excluding energy. Treasury yields fell modestly, and corporate bonds outperformed as credit spreads tightened to late January levels. However, the ceasefire was already being tested late in the week, with the market closely monitoring this weekend’s talks.
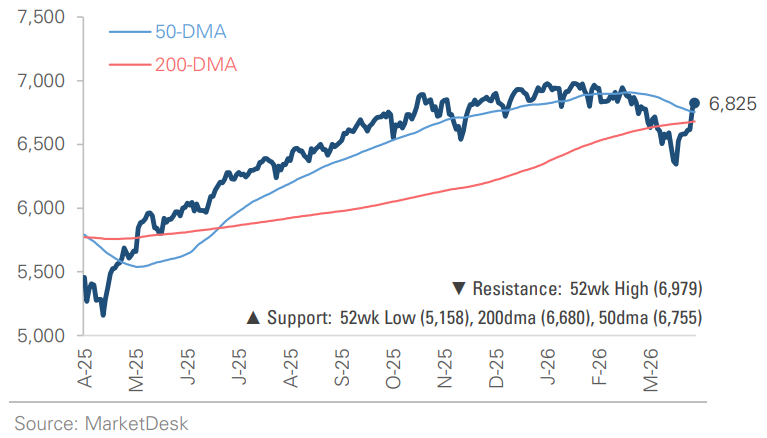
S&P 500 Index (Last 12 Months)
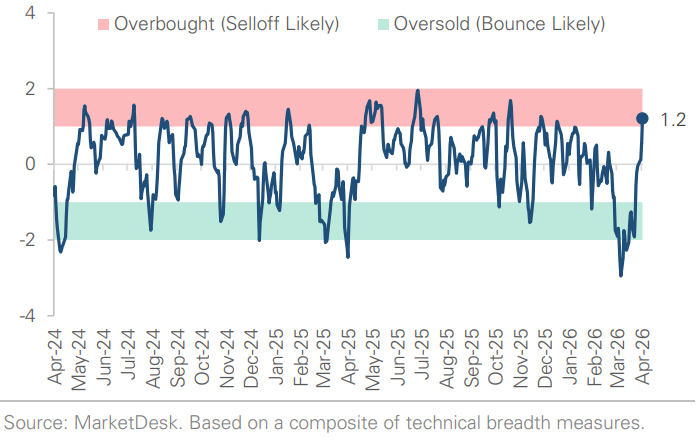
S&P 500 Technical Composite (Last 24 Months)
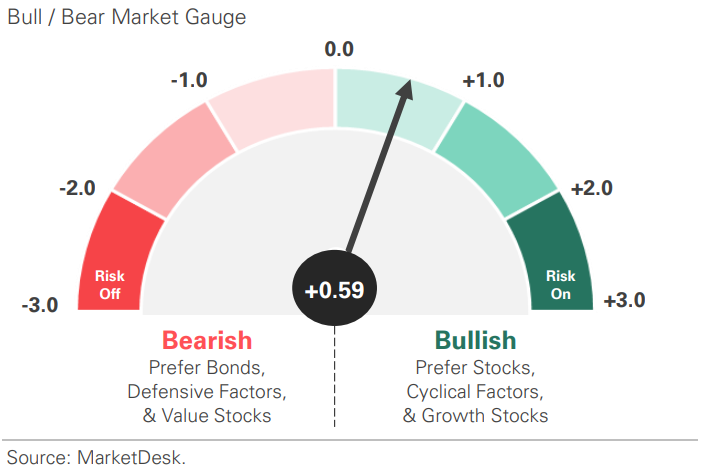
US Risk Demand Market Indicator
The US Risk Demand Indicator (USRDI) is a quantitative tool to measure real-time investor risk appetite. When the indicator is above zero, it signals a risk-on environment favoring cyclical sectors, high beta stocks, high-yield corporate bonds, and hybrid (convertible) bonds. In contrast, a reading below zero signals a risk-off environment favoring defensive sectors, low-volatility stocks, and US Treasury bonds.
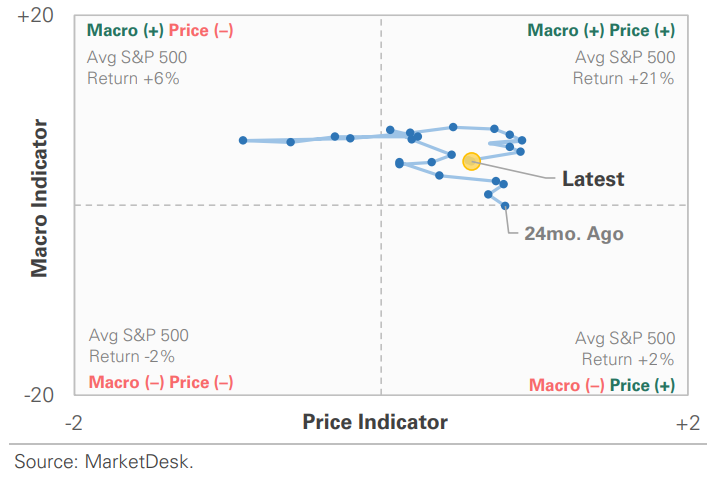
US Market Economic Cycle Indicator
The Market Cycle Indicator tracks two primary investor groups: macro investors and price-based investors. Macro investors rely on fundamental and economic data to guide their decisions, while price-based investors (or technical analysts) focus on price action, momentum, volume, and behavioral trends. The Indicator synthesizes these perspectives to identify the prevailing market regime.
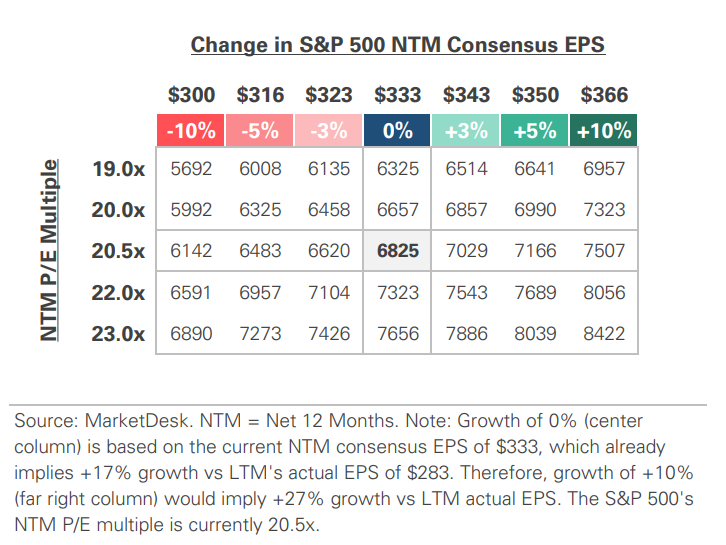
S&P 500 Valuation Matrix
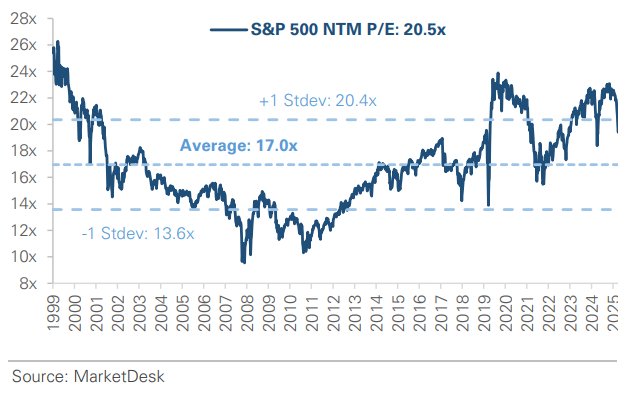
S&P 500 Forward PE Ratio
The S&P 500 forward price-to-earnings (P/E) ratio is a widely followed valuation metric that compares the index's current level to the projected earnings of its constituent companies over the next 12 months. The indicator implies to investors how much they are paying today for each dollar of expected future earnings.
Key Takeaways
#1 - A Ceasefire Relief Rally
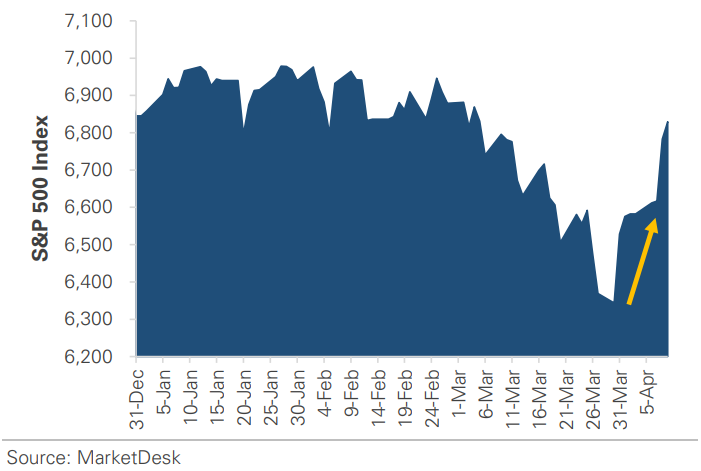
The U.S. and Iran agreed to a two-week ceasefire, triggering a relief rally. Late Tuesday, the White House announced an agreement contingent on Iran reopening the Strait of Hormuz, less than two hours before a stated deadline to launch strikes on Iranian infrastructure. Markets reacted decisively on Wednesday: the S&P 500 surged +2.5%, its best single-day gain in a year, the Dow jumped +2.9%, the Russell 2000 gained +3.0%, and international equities rallied +3.5%. Unlike prior headlines, this was an actual agreement confirmed by both sides, with talks scheduled for this weekend.
Implication: The ceasefire is meaningful, but its durability was tested within hours. Israel launched strikes across Lebanon, Iran accused the U.S. of violating three conditions, and the Strait remained effectively closed Thursday morning. This weekend’s talks will determine whether the agreement marks a turning point.
S&P 500 Extends Rally from Late-March Lows
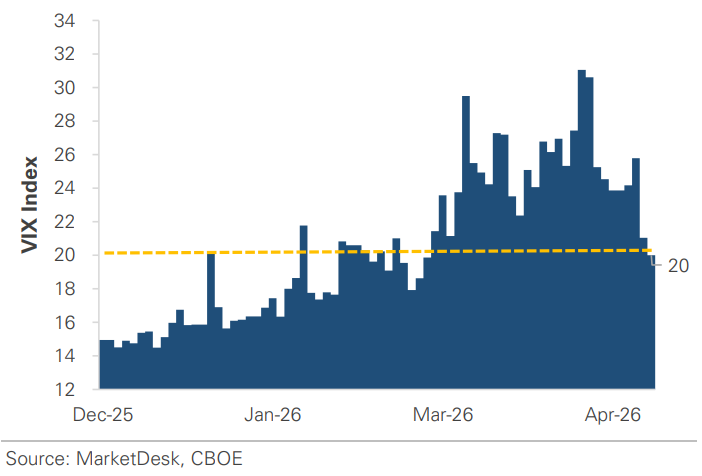
VIX Index Falls Below 20 for First Time During Conflict
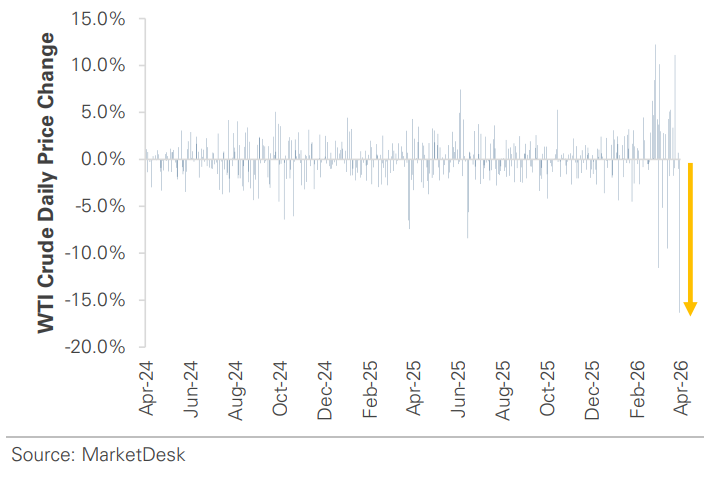
#2 - Oil Plunges
Oil plunged 16% on Wednesday, its largest single-day decline since April 2020, as the market priced in a reopening of the Strait of Hormuz. WTI fell from $112 to around $94, erasing weeks of the war-driven rally that had pushed oil up over +65% YTD. The decline triggered immediate secondary effects: airline stocks surged, and the odds of a rate cut increased as inflation expectations eased. However, the physical reopening remains uncertain. As of Thursday morning, the Strait was still effectively closed, and oil was moving back toward $100.
Implication: Oil is the transmission mechanism through which the conflict reaches inflation, the Fed, consumers, and corporate profits. Wednesday’s decline showed how quickly the geopolitical premium can unwind, with the market watching for actual follow-through.
Oil Plunges -16% on News of Ceasefire Agreement
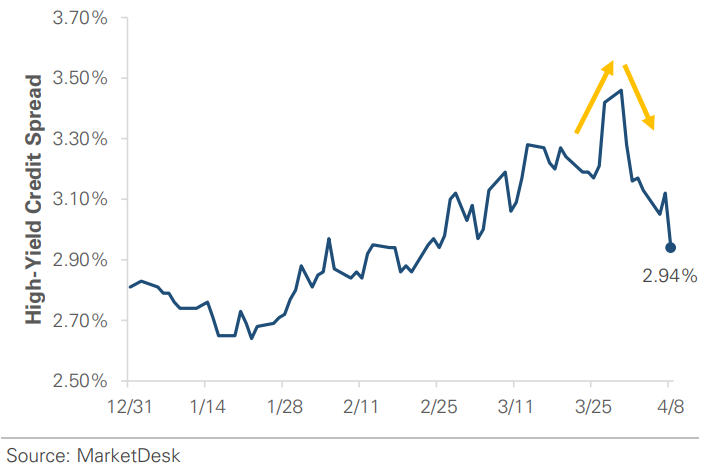
#3 - Risk-Appetite Shift Continues
Credit spreads tightened, and volatility declined, confirming the shift in risk appetite across asset classes. High-yield spreads compressed during Wednesday's ceasefire rally and are now the lowest since late January, having tightened nearly 0.50% over the past two weeks. Credit spread tightening indicates that the market is starting to price in less stress. The VIX fell to 21, its first close below 22 since late February, after touching 28 intraday Tuesday before the ceasefire was announced
Implication: Credit and volatility are the market's most reliable stress indicators, and both confirmed the equity rally as broad-based rather than speculative.
#4 -Treasury Yields Unchanged
Treasury yields barely moved despite the ceasefire rally. The 10-year yield fell just -0.03% to 4.28%, a muted response given the magnitude of the oil crash and equity rally. The bond market’s reaction reflects the Fed’s policy forecast. Seven of nineteen Fed members forecast zero cuts in 2026, and the Fed’s March minutes, released this week, reaffirmed its patient approach.
Implication: The bond market’s restraint suggests it is waiting for confirmation that the ceasefire will meaningfully improve the inflation and growth outlook.
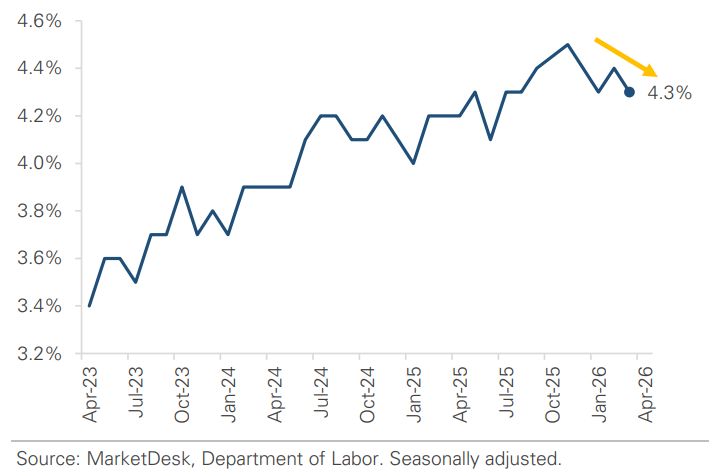
Unemployment Rate Declines to 4.3%
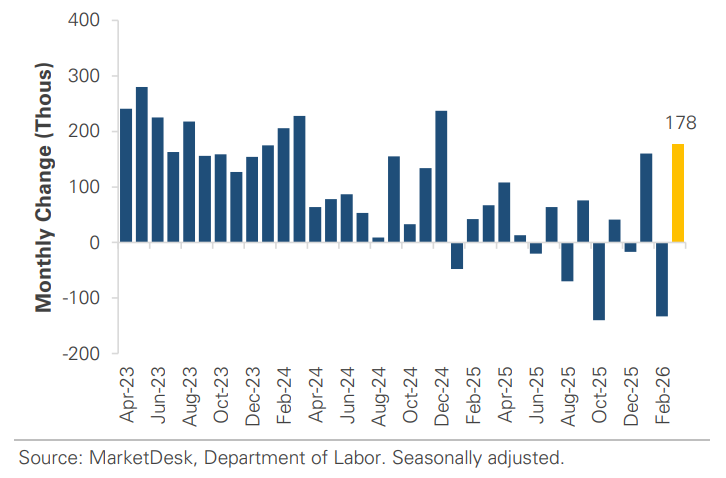
Job Growth Rebounded in March
High-Yield Spread Tightens to Late-January Levels
#5 - Q1 Earnings Season Begins
Next week unofficially kicks off Q1 earnings season, with the big Wall Street banks reporting. The focus will extend beyond the usual revenue and earnings beats to management commentary on the conflict’s impacts, from energy costs and supply chain disruptions to consumer demand and forward estimates.
Implication: Earnings calls will provide the first corporate read on how the energy shock is flowing through margins, pricing, and demand. Forward guidance and tone may matter more than the headline numbers this quarter.
Important Disclosures
This material is provided for general and educational purposes only and is not investment advice. Your investments should correspond to your financial needs, goals, and risk tolerance. Please consult an investment professional before making any investment or financial decisions or purchasing any financial, securities, or investment-related service or product, including any investment product or service described in these materials.
Our Insights


