Trade Deficit Weighs on GDP, Labor Market Remains Solid, and Fed Holds Rates Steady

Photo Credit: Nick Fewings, Unsplash
Weekly Market Recap for May 9th
This week, stocks sold off early in the week but rebounded to finish higher after the administration announced a UK trade deal. The Russell 2000 led the gains and outperformed the S&P 500, with outperformance from the Equal Weight, Value, and High Beta factors as well. Cyclical sectors broadly outperformed, while defensive sectors lagged the broader market. In another sign of risk-on appetite, high-yield corporate bonds outperformed in the credit market, while investment-grade and Treasury bonds traded lower. Volatility eased across markets, with both the VIX and MOVE indices falling as tensions continue to de-escalate. Meanwhile, the US dollar strengthened, and oil prices rose despite OPEC signaling plans to increase output.
S&P 500 Index (Last 12 Months)

S&P 500 Technical Composite (Last 24 Months)

Bull Bear Market Indicator
The Bull Bear Market Indicator is a quantitative tool to measure real-time investor risk appetite. When the indicator is above zero, it signals a risk-on environment favoring cyclical sectors, high beta stocks, high-yield corporate bonds, and hybrid (convertible) bonds. In contrast, a reading below zero signals a risk-off environment favoring defensive sectors, low-volatility stocks, and U.S. Treasury bonds.

US Risk Demand Indicator
The US Risk Demand Indicator is a quantitative model that measures investors’ willingness (or lack thereof) to increase portfolio risk. The indicator is a composite of momentum measures across four asset classes: equities, equity derivatives, credit markets, and foreign currencies. A reading above zero suggests investors should increase portfolio risk to benefit from rising market momentum. A reading below zero suggests investors should decrease portfolio risk to protect capital from falling market momentum.

US Market Economic Cycle
The Market Cycle Indicator tracks two primary investor groups: macro investors and price-based investors. Macro investors rely on fundamental and economic data to guide their decisions, while price-based investors (or technical analysts) focus on price action, momentum, volume, and behavioral trends. The Indicator synthesizes these perspectives to identify the prevailing market regime.

S&P 500 Valuation Matrix

Key Takeaways
#1 - US Trade Deficit Surged To A Record High In March
US businesses accelerated imports ahead of Trump’s tariffs. The widening trade deficit underscores the complex effects that trade policies are having on economic data.
Implication: The threat of tariffs influences business and consumer behavior, making it difficult to gauge the economy’s true health.
Trade Deficit Expands As Businesses Front-Run Tariffs

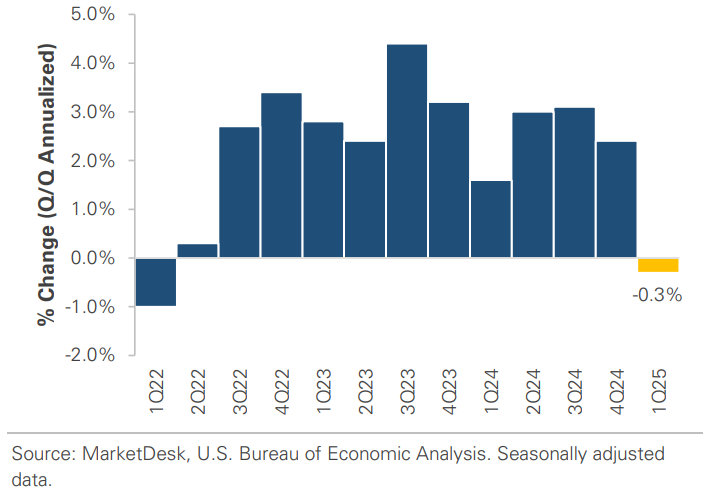
#2 - Import Surge Weighed On US Economic Growth During Q1
The surge of imports caused the US GDP to contract by -0.3%. It was a sharp slowdown from Q4’s +2.4% growth and the first contraction in three years. The main driver was a +41.3% surge in imports, as businesses accelerated purchases and built up inventories ahead of tariffs.
Implication: Imports weighed heavily on US Q1 GDP, but as import levels normalize, the trade drag could reverse and temporarily lift GDP growth.
US Q1 GDP Growth Turns Negative As Imports Surge
#3 - US Core GDP Growth Remains Solid
Earlier this week, prices briefly rose above $3,500 per ounce, an all-time high. The precious metal's strength has been driven by market volatility, policy uncertainty, and Trump's Fed criticism.
Implication: The flight to gold signals increased investor caution. It is telling that investors bypassed traditional safe-haven assets, such as US Treasury bonds and USD, as they sought safety.
US Core GDP Shows Economy’s Underlying Resilience

#4 - Labor Market Remains Strong
The US added +177,000 jobs in April, and unemployment remained 4.2%. We believe the policy and trade uncertainty have put hiring and firing decisions on hold as companies wait for clarity.
Implication: April’s job growth suggests the labor market is holding up despite policy uncertainty. The report’s strength alleviates recession concerns but also pushes back the timing of rate cuts.
Job Growth Remains Solid Despite Policy Uncertainty

#5 - The Fed Holds Interest Rates Steady
As expected, the Fed held interest rates steady at its meeting this week. The statement emphasized a cautious, data-dependent approach and warned about elevated inflation and unemployment risks. At the press conference, Powell stated that the current policy stance is well-positioned and emphasized the need for more data before making any moves. It is unclear how the Fed can avoid being late, as it will likely wait for the labor market to weaken before cutting. The risk is that unemployment is a lagging indicator.
Implication: The timing of rate cuts is delayed as resilient hard economic data supports the Fed’s patient approach. Over the past week, the probability of a June rate cut dropped sharply from nearly 70% to just 22%.
Probability of a Fed Rate Cut In June

#6 - Mixed Market Signals
Different areas of the market are sending mixed signals about the outlook. The chart below shows price returns across major asset classes since March 31st, capturing performance since the tariff announcements. The S&P 500 and high-yield bonds have recovered all their losses and are flat. However, gold prices and the VIX remain elevated, and oil has plunged nearly -20%.
Implication: Equity prices have seen little to no impact, but gold, the VIX, and oil signal concerns about slower economic growth and continued market volatility.

Important Disclosures
This material is provided for general and educational purposes only and is not investment advice. Your investments should correspond to your financial needs, goals, and risk tolerance. Please consult an investment professional before making any investment or financial decisions or purchasing any financial, securities, or investment-related service or product, including any investment product or service described in these materials.
Our Insights